HOW WELL YOUR PRODUCT IS REALLY DOING
- by Georges Duverger
- You built a product. You invited users. And now you're wondering if it's any good.
- You ask them if they like it. They have okay feedback but they won't give it to you straight. They don't want to hurt your feelings. And it wouldn't be conclusive anyway.
- So you install an analytics tool like Google Analytics, Heap, or Mixpanel. Hours later, you're the proud owner of a firehose of user data. And it's now your job to make sense of it.
- You get to work. You calculate the conversion rate, average time on site, interactions per visit. You divide your daily active users over your monthly active users. You come up with all kinds of ratios and graphs but you're still wondering… how well is my product really doing?
- To answer, you need to know what states your users are in. From having never used your product to being a first-time user, an inactive user, a low-value user, or a high-value user.
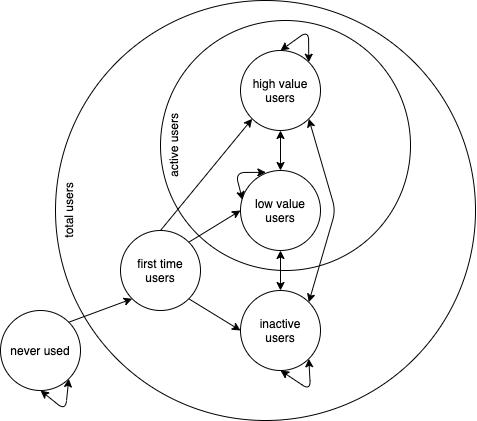
- There is a big difference between a first-time user becoming inactive (bounce) and an active user becoming inactive (churn). You don't get that difference from a DAU/MAU ratio.
- All you have to do is define what value means for your users. For example, it can be the number of sessions. 1 to 19 sessions in a month can be low value. 20+ sessions in a month can be high value. 0 is inactive.
- Once that's done, look at what states your users fall in and you'll see where to focus your efforts.
- That approach is based on Phil Libin's Model to Answer All Startup Growth Questions.
- Made in Arlington, MA. Generated with Ivy. Styled with Backslash. All emojis designed by OpenMoji – the open-source emoji and icon project. License: CC BY-SA 4.0